Smarter Forecasting with ABC–XYZ: Matching Models to Product Behavior and Business Value
- Yvonne Badulescu
- Dec 15, 2025
- 6 min read
Not All Products Behave the Same, So Why Forecast Them That Way?
Imagine trying to forecast daily demand for toothpaste the same way you would for holiday gift baskets. One sells steadily year-round, the other spikes unpredictably. Yet in many businesses, all products are still forecasted using the same models, with the same assumptions, and often with the same level of effort. The result? Overstocked warehouses, stockouts during peak demand, and wasted hours spent fine-tuning the wrong items.
To make forecasting smarter and more impactful, top-performing supply chains use product segmentation by grouping items based on how much they matter to the business and how predictable their demand is. The ABC–XYZ classification is one of the most effective ways to do this. It helps planners focus attention where it counts, applying the right forecasting methods to the right products, and avoiding the trap of one-size-fits-all planning.
The ABC XYZ framework segments products along two dimensions. The ABC classification ranks items by their contribution to revenue or margin. A items represent a small portion of SKUs that generate the majority of value, B items have moderate impact, and C items contribute the least. The XYZ classification, on the other hand, reflects demand variability. X items have consistent, predictable demand, Y items show moderate fluctuations often due to seasonality or promotions, and Z items are highly erratic or intermittent. By combining these two views, demand planners can assign each product to one of nine segments and apply forecasting models that align with the specific demand pattern and business priority of each group.
Before jumping into more detail for each segment below, the table below provides an overview of how a variety of Migros products can be classified using the ABC–XYZ segmentation approach.


How to Determine ABC and XYZ Classifications
ABC classification is typically based on annual sales revenue, profit margin, or volume. Products are ranked in descending order by the selected metric, most commonly annual sales value, and cumulative percentages are calculated. This process reflects the Pareto principle, where a small percentage of items account for a large share of value:
A items represent approximately 10–20% of SKUs but generate 70–80% of total value.
B items make up around 30–40% of SKUs, contributing 15–25% of value.
C items often comprise more than 50% of the assortment, while accounting for only 5–10% of value.


This classification helps businesses prioritize resources, ensuring that the highest-value items receive the most accurate forecasts and active planning.
XYZ classification addresses demand variability, which is typically measured using the coefficient of variation (CV), the ratio of the standard deviation of demand to the mean demand:

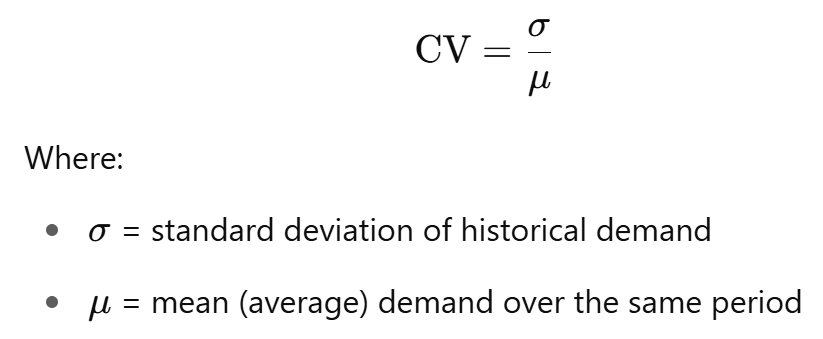
X items have a low CV (below 0.2), indicating highly stable and predictable demand.
Y items have a moderate CV (between 0.2 and 0.5), often driven by seasonality, promotions, or external trends.
Z items exhibit a high CV (above 0.5), reflecting erratic, intermittent, or highly uncertain demand.
Organizations may refine XYZ classification further by including additional indicators such as the frequency of orders, the number of zero-demand periods, or the intermittency index, particularly for spare parts, niche products, or slow-moving SKUs. The resulting segmentation allows for targeted forecasting and inventory strategies, aligning model complexity and planning effort with the actual behavior and strategic importance of each item.
Which Forecasting Model Is Best Per Product Segment?
When deciding on which forecast model to use per ABC-XYZ product segment, the objective is to match the forecasting effort and complexity to the strategic importance and behavior of each item.


X segments represent products with low variability in demand, meaning their sales patterns are stable and predictable over time. These products are well suited for traditional time series models.
In the AX segment, products are both high in value and very stable. Exponential smoothing or ARIMA models are recommended because they handle regular patterns efficiently and produce reliable forecasts without frequent manual adjustments.
For BX items, which are of moderate value and also stable, simple exponential smoothing or moving averages are sufficient. These models require little maintenance and provide adequate accuracy for their relative importance.
CX items are low in value and also stable. Because their business impact is minimal, naïve forecasts or basic reorder point rules are appropriate. More advanced forecasting offers limited additional benefit.
Y segments contain products with moderate variability. These items may be affected by promotions, seasonality, or regional demand shifts, making them somewhat more complex to forecast.
AY products are high-value items with moderately variable demand. Holt-Winters models can capture seasonality, and regression models with external drivers like marketing campaigns, holidays, or weather are also effective. When external data is available, machine learning models may offer further improvements. Judgmental input is often valuable here, especially to anticipate planned events.
BY products have moderate value and moderate variability. Seasonal averages or cluster-based forecasting at the category level work well, especially if SKUs share similar demand patterns. Machine learning approaches may be useful in aggregated forecasts, and judgment can help with regional or event-based adjustments.
CY items are low in value and moderately variable. Rule-based models using adjusted historical averages or past promotional impacts are recommended. Machine learning is rarely justified, but planners may occasionally apply judgment during promotional periods.
Z segments are characterized by high demand variability. These products tend to have erratic or intermittent demand, often with many zero-sales periods or sudden one-time spikes.
AZ products are high in value but highly unpredictable. Intermittent demand models such as Croston or Teunter-Syntetos-Babai (TSB) are suitable here. However, due to their strategic importance, expert judgment is often essential, particularly for product launches, one-time campaigns, or high-margin specialty items.
BZ products have moderate value and very erratic demand. Forecasting accuracy is limited, so basic intermittent models and safety stock buffers are typically used. Judgment may help when demand is driven by specific campaigns or niche buyers.
CZ items are low in value and extremely unpredictable. These are often slow movers, discontinued products, or items kept for catalog completeness. Formal forecasting is not recommended. Instead, companies should rely on periodic reviews, minimal stock levels, or delisting decisions, with judgment used more for assortment management than for predicting demand.
Important Considerations and Limitations of ABC–XYZ Segmentation
While each segment in the ABC–XYZ matrix lends itself to certain forecasting techniques, no single method is universally optimal. The recommended approaches are based on general demand characteristics, but their performance depends on several contextual factors, including:
Data availability and quality (e.g., missing values, short history, high noise)
Product lifecycle stage (e.g., new launches, end-of-life SKUs)
External influences (e.g., promotions, weather, market trends)
Operational constraints (e.g., planning system limitations, team expertise)
For example, while exponential smoothing may perform well for stable AX items in theory, outliers, untracked promotions, or poor parameter settings can still degrade forecast accuracy. Similarly, Croston-based methods for AZ or CZ items assume intermittent demand but may fail if the item actually follows a lumpy or seasonal pattern with long periods of zero followed by spikes.
Should ABC–XYZ Segmentation Be Done at SKU Level or Product Family Level?
ABC–XYZ analysis is typically performed at the SKU level, particularly in industries where demand and value vary significantly between similar-looking items. At the SKU level, planners can capture the specific behavior of each product variant (such as size, flavor, or packaging type) and tailor forecasts and inventory policies accordingly. This is especially important in FMCG, retail, and e-commerce, where even small variations can lead to major differences in sales volume and demand volatility.
However, segmentation at the product family or category level can be appropriate in certain cases:
When SKUs within a family exhibit similar demand behavior (e.g., standardized industrial parts or basic commodities)
When data granularity is insufficient for reliable SKU-level analysis
When planning is centralized at a category level and replenishment is pooled
Although academic literature generally supports SKU-level segmentation for operational planning precision, in practice, many companies use a hybrid approach:
Perform ABC classification at SKU level to prioritize based on value.
Perform XYZ classification either at SKU level or aggregated at family level, especially when individual SKUs are too erratic or infrequently sold.
ABC–XYZ segmentation is a valuable framework for aligning forecasting methods with the behavior and importance of individual products. However, it is not a plug-and-play solution. Forecast model performance depends on context, and planners must consider factors such as data quality, external influences, product lifecycle stage, and system capabilities. Additionally, while SKU-level segmentation offers the greatest precision, a hybrid approach may be more practical in environments with data limitations or pooled replenishment.
Ultimately, successful implementation relies on using ABC–XYZ as a guide, not a rule, and continuously validating models against real-world performance to ensure that forecast accuracy supports both operational efficiency and business value.


Comments